
Power Outages
From: To:
 NOTE:
Reliability challenges persist on units that have not yet under gone remediation. As a result, forced outages and short-duration (“pit-stop”) maintenance interventions will continue to be undertaken based on plant condition.
Key performance metrics have, however, improved materially. Mean Time to Repair (MTTR) has been reduced from approximately 30-50 days to 12 days.
In addition, Mean Time Between Failures (MTBF) has increased, with units now remaining on the grid longer for an average of 120 days before a failure occurs.
Collectively, these improvements provide a sound basis for the positive energy availability outlook.
NOTE:
Reliability challenges persist on units that have not yet under gone remediation. As a result, forced outages and short-duration (“pit-stop”) maintenance interventions will continue to be undertaken based on plant condition.
Key performance metrics have, however, improved materially. Mean Time to Repair (MTTR) has been reduced from approximately 30-50 days to 12 days.
In addition, Mean Time Between Failures (MTBF) has increased, with units now remaining on the grid longer for an average of 120 days before a failure occurs.
Collectively, these improvements provide a sound basis for the positive energy availability outlook.
From: To:
 NOTE:
Reliabilitychallengespersistonunitsthathavenotyetundergoneremediation. As a result, forced outages and short-duration (“pit-stop”) maintenance interventions will continue to be undertaken based on plant condition.
Keyperformancemetricshave,however,improvedmaterially.MeanTimeto Repair (MTTR) has been reduced from approximately 30-50 days to 12 days.
Inaddition,MeanTimeBetweenFailures(MTBF)hasincreased,withunitsnow remaining on the grid longer for an average of 120 days before a failure occurs.
Collectively,theseimprovementsprovideasoundbasisforthepositiveenergy availability outlook.
NOTE:
Reliabilitychallengespersistonunitsthathavenotyetundergoneremediation. As a result, forced outages and short-duration (“pit-stop”) maintenance interventions will continue to be undertaken based on plant condition.
Keyperformancemetricshave,however,improvedmaterially.MeanTimeto Repair (MTTR) has been reduced from approximately 30-50 days to 12 days.
Inaddition,MeanTimeBetweenFailures(MTBF)hasincreased,withunitsnow remaining on the grid longer for an average of 120 days before a failure occurs.
Collectively,theseimprovementsprovideasoundbasisforthepositiveenergy availability outlook.
From: To:
 NOTE:
Reliability challenges persist on units that have not yet under gone remediation. As a result, forced outages and short-duration (“pit-stop”) maintenance interventions will continue to be undertaken based on plant condition.
Key performance metrics have, however, improved materially. Mean Time to Repair (MTTR) has been reduced from approximately 30-50 days to 12 days.
In addition, Mean Time Between Failures (MTBF) has increased, with units now remaining on the grid longer for an average of 120 days before a failure occurs.
Collectively, these improvements provide a sound basis for the positive energy availability outlook.
NOTE:
Reliability challenges persist on units that have not yet under gone remediation. As a result, forced outages and short-duration (“pit-stop”) maintenance interventions will continue to be undertaken based on plant condition.
Key performance metrics have, however, improved materially. Mean Time to Repair (MTTR) has been reduced from approximately 30-50 days to 12 days.
In addition, Mean Time Between Failures (MTBF) has increased, with units now remaining on the grid longer for an average of 120 days before a failure occurs.
Collectively, these improvements provide a sound basis for the positive energy availability outlook.
From: To:
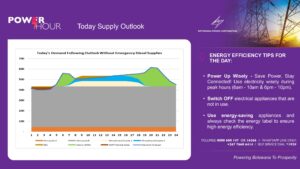
From: To:
NOTE:
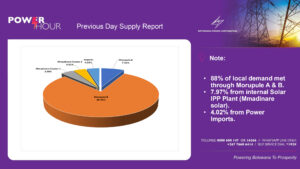
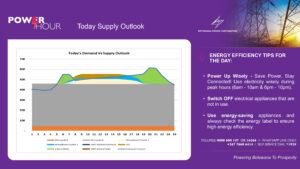
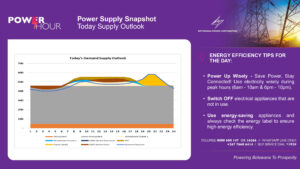
- 85.68% of local demand met through Morupule A & B. 7.90% from internal Solar IPP Plant (Mmadinare solar). 6.42% from Power Imports.
 Last Updated: 2026-02-05 09:12:39
From: To:
Note:
85.68% of local demand met through Morupule A & B.
7.90% from internal Solar IPP Plant (Mmadinare solar).
6.42% from Power Imports.
Login into your account
With new BPC customer portal, you can pay and analyze your bills online, view your energy use and sign up for paperless billing.